
This post was originally published on this site.

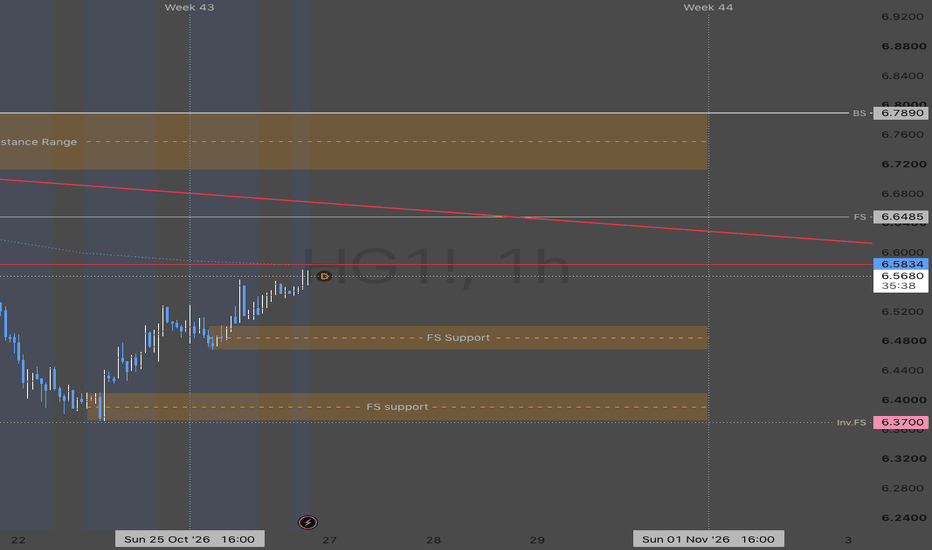
HG | Copper Futures | Week 43 – 1hr Chart
This is Multiple timeframe analysis through 8 timeframes.
Everything labeled on screen and is explained below.
If you care to understand “Candle Science” (price action T.A.) continue reading…
Its 4 candles total – 2 on the support side, 2 on the resistance side. These 4 candles create 6 levels (3 each). They illustrate price action and market structure so traders can articulate the trade entry, risks, and targets with dates, times and prices of the candles creation and have an emotionless bias based on the expectations of that level or the expectation of combined levels.
Black = Year,
Pink = Month,
Grey= Week,
Red = Day,
Orange = 4HR,
Yellow = 1HR,
Blue = 15min,
Green = 5min.
Strength favors the higher timeframe.
(BS) means Backside of a support range.
(FS) Means Frontside of a support range.
*_They are the first and last distribution candles in a distribution range and they represent Support.
(Inv. BS) means Inverse Backside.
(Inv. FS) means Inverse Frontside.
*_They are the first and last accumulation candles in an accumulation range and they represent Resistance.
***Price Action T.A. is built on the premise that – when price is below an accumulation range, it will act as resistance to price. When price is above a distribution range, it will act as support for price.
**A Range is defined as two or more consecutive color candles; thus creating accumulation ranges and distribution ranges. A single candle is a range on a lower timeframe – find it.
“Range finding” is important. Finding the range and defining its boundaries helps identify entry, risk, and profit targets with a methodology that is data driven by dates and price’s of the candles creation.
EXPECTATIONS for the (BS) Backside of the range and the (FS) Frontside of the range are different when price action is approaching.
*_ The Backside of the range is where price enters the range. The expectation that liquidity is waiting at the entrance should cause candles to create long wicks to and away from this level creating high angle trends and f.v.g’s.
If that is not seen, price action will enter the range targeting the (FS) frontside where the expectation is low angle accumulation trends, wedges and ladders of accumulation supporting price until a trend break out and or price can get above the (BS) candle to confirm the accumulation and gain volatility.
Same for the Inverse levels/ranges but they form distribution trends and reversals.
That’s Candle Science TA.


