This post was originally published on this site.

Gold: One-Year Floor Broken – Retest or 3,800 Next?
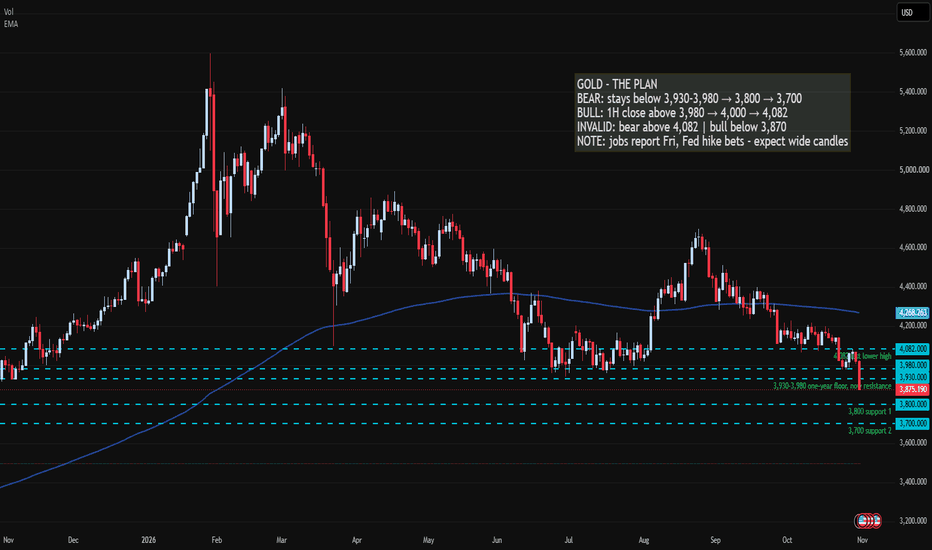
Gold fell about 3.6% on Friday, from near 4,024 to a close near 3,875, its lowest level in a year. A hotter US PCE inflation reading (3.6%) and strong growth data lifted expectations of a December Fed rate hike.
STRUCTURE (daily chart, 1 year)
Downtrend since the late-August high near 4,690, with lower highs at about 4,500, 4,400, 4,225 and 4,082.
The 3,930-3,980 zone was the floor all year: the November 2025 low, the June and July lows and last week’s base. Friday closed below it.
That zone is now the first resistance. Above it: 4,000, then 4,082 (the last lower high).
Support: 3,870 (Friday’s low), then 3,800 and 3,700.
BEARISH SCENARIO
Price stays below 3,930-3,980 on a retest.
Targets: 3,800, then 3,700.
Invalid on a 1H close back above 4,082.
BULLISH SCENARIO
A 1H close back above 3,980 turns Friday’s break into a false break.
Targets: 4,000, then 4,082.
A real trend change needs a close above 4,082.
WHAT I’M WATCHING
The first retest of 3,930-3,980.
US midterm elections on Tuesday 3 Nov and the jobs report on Friday 6 Nov.
Oil above $100 and December Fed hike bets. Gold has not acted as a safe haven during the stock selloff.
Key levels: 3,700 | 3,800 | 3,870 | 3,930-3,980 | 4,000 | 4,082
Educational analysis only, not financial advice.


