
This post was originally published on this site.

So goes IONQ, so goes quantum
IonQ, Inc. BATS:IONQ
It’s still a difficult trading environment due to macro factors like yields, rates, oil prices, etc. The war in Iran presents geopolitical risk which is doing a lot of the driving of those macro factors.
But opportunities still exist, and if we get a reprieve – for instance if US wins the war in Iran for the 11th time – equities may get a lift.
- On the theme of quantum computing itself: IonQ makes hardware and software for quantum but is a heavyweight holding within the theme, so if IonQ makes a move then the sector should see a pickup generally. As of right now though, the theme has logged three consecutive weeks improving in my sector rotation dashboard. This tool tracks themes are performing relative to index benchmarks.
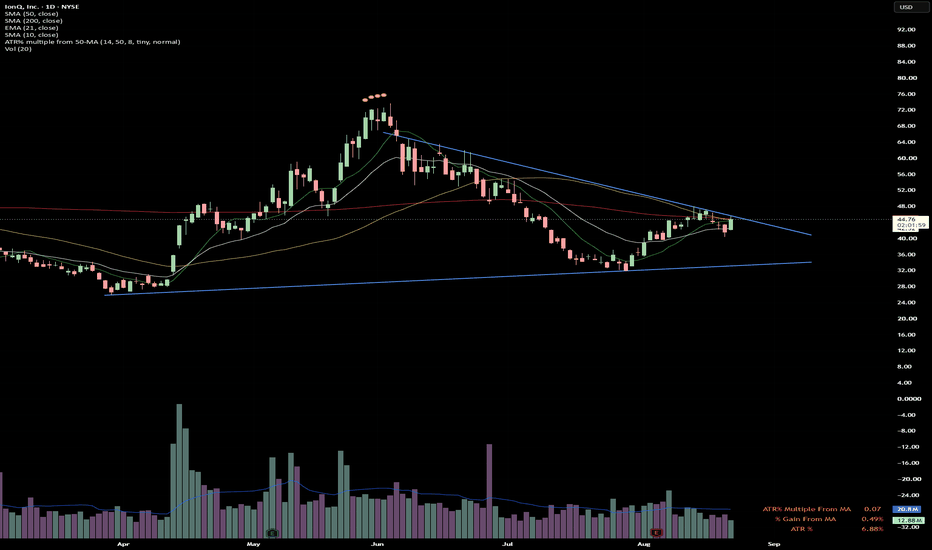
- Starting with technicals: IONQ is in a triangle outlined by the blue lines in the chart. The lower line anchors to lows in March of 2025 (not pictured here). The upper line acts differently: when IONQ hit the June high this summer, it dropped around 23% in two days. Rather than anchor to that drastic drop, I anchor to the post-drop period. And what we see here is that it bounced off of support in late July and has rallied ~40%. Price is still trapped inside, and could stay there longer, but a breakout that clears this rally-high at 48 could really get this moving and put an end to the lower highs in the triangle.
- We’re now at a really interesting spot where all the moving averages have converged: short-term trends from 10sma and 21ema are meeting intermediate 50sma and long term 200sma. This week was the first backtest to the short-term trend lines, and price responded favorably. If price breaks out from the 50- and 200- now, then intermediate and longer term trends begin to shape up. I’ve seen plenty lately where price breaks these intermediate and long term lines, then pulls back to test them, and then goes. (This is also what’s happening now with short-term trends). There’s a lot going on in here.
- On the weekly chart, the MACD histogram is approaching zero from negative, and positive momentum from price is reflected here. The MACD line crossing the signal line is not far off if price continues its upward trajectory, a bullish cross that shows short-term momentum is accelerating against recent baseline.
- IONQ remains below both the daily and weekly ichimoku cloud model, and that places major resistance around 52 and then 55.30. Gives me something to track going forward if I enter.
- A lot of entry options for me: Watch for price breaking out from the cloud and pulling away from the moving averages. There is also the possibility of entering here, now, and placing stop below recent low (yesterday) of 40.33. This is about $3.40 per share of risk, not great, but possible with smaller risk. Another option, possibly safest in this atmosphere, is to let the breakout prove itself by clearing that ~48 area and then try to buy close to the 10sma or 21ema when they catch up. Could justify any one of these, but I am going to just wait for now, but watch closely.


